Reading "The Art of Statistics" by David Spiegelhalter
- tuan nguyen
- Apr 30, 2019
- 8 min read
Statistics is often seen as a science (e.g., statistical science), but it can also be viewed as an art. Professor David Spiegelhalter’s latest book explains how the art of statistics can enlighten our life with wisdoms and insights.

David Spiegelhalter is an accomplished scientist - statistician. He is Chair of the Winton Centre for Risk Evidence Communication in the Statistical Laboratory at the University of Cambridge. He is Professor of Public Understanding of Risk at Cambridge University. He was elected as President of the Royal Statistical Society (2017-2018), Fellow of the Royal Society in 2005, awarded an OBE in 2006, and knighted in 2014. He is one of the most cited and influential scientists in the field of statistics.
However, don't let his academic background put you off. He is a great teacher of statistics, and a wonderful communicator of risk. His style is fairly conversational, often warm, and sometimes witty. The Art of Statistics is a testament to those traits. Throughout the book, readers will not find any formulae. Introducing a tough topic such as statistics without a single formula is to me a sign of a masterful work.
To many people -- in as well as out of academia -- statistics is a hard topic. Lay people often understand statistics to be only about counts and frequencies. Most people can hardly make sense of proportions, odds, or average, let alone the coefficient of correlation. But they are not alone; generation after generation of university students struggle to understand abstract statistical concepts operationalized by mostly esoteric formulae. I myself used to find statistical texts rather dull, because they are populated with coin flipping and gambling exercises which seem irrelevant, even thoughtless, to the real world of science and society. Spiegelhalter's Art of Statistics is not like those texts; it is -- or promises to be -- a joyful reading.
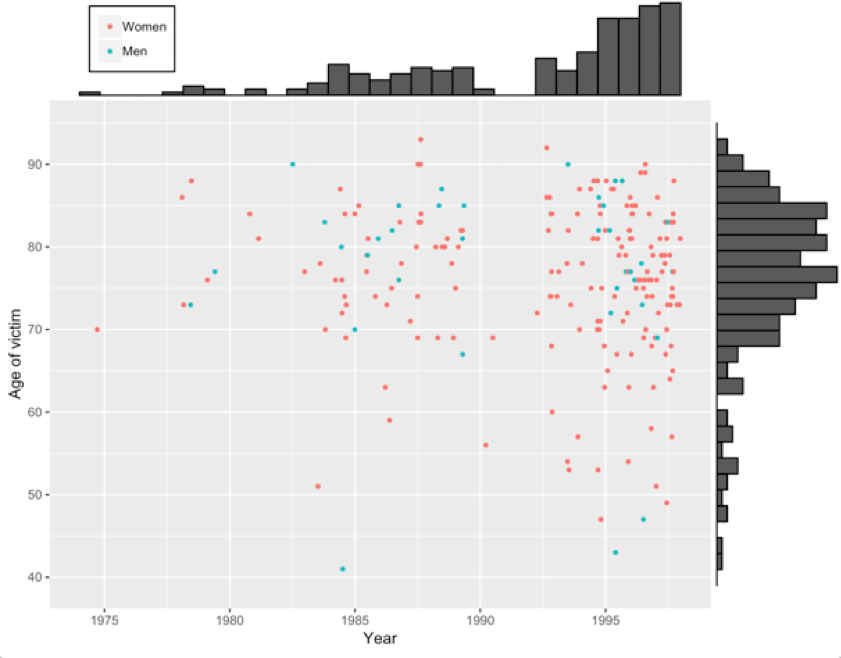
The book can be seen as a thin veiled introduction to statistics, but it is not necessarily written for university students; it is for lay people and the public at large. Lay people love stories and questions, because they serve as catalysts for productive conversations. And, the book is structured with plenty of interesting stories that surely stimulate thinking in many creative ways. Spiegelhalter starts off with a tragic story about an English doctor named Harold Shipman who had killed at least 215 patients between 1975 and 1998. The Shipman's story includes actual data on age, gender, time and year of death of all victims. A simple listing of those data does not tell us anything. Instead, Spiegelhalter applied some simple statistical graphics to visualize the data, and the result is an insight into the crime: most of Shipman's victims were in their 70s and 80s, and they tended to die in the early afternoon. Of course, the analysis could not tell us why they died at that time, but an official enquiry into the crime revealed that Shipman often visited his patients at home after lunch, when he would inject them with a massive dose of diamorphine he said was to make them more comfortable. The simple analysis enable the data to 'speak'. Through the simple analysis, Spiegelhalter makes the point that "numbers do not speak for themselves, we are responsible for giving them meaning" (page 27). Statistics is a very powerful tool to extract lively information from cold data.

Fig 1: a simple scatter plot of age at death and year of death of 215 victims. The plot reveals that most victims were in their 70s and 80s. There is a 'gap' between 1990 and 1992 in the graph, because during that period Harold Shipman worked for a private practice.
From the tragic Shipman's story, Spiegelhalter launches into a series of discussions on various statistical subjects. These include the analyses of categorical data and continuous data; using sample data to make inferences concerning population parameters; hypothesis testing; modelling relationships using linear regression and logistic regression; survival analysis; and prediction and analytics. The book also touches on topical issues such as reproducibility and risk communication. Spiegelhalter is a renowned Bayesian statistician, and readers can surely bet that he has a chapter on Bayesian inference which he termed 'Learning from Experience'.
Each of those subjects is commenced with a story or a question. Starting with the question of "How many trees are there on the planet", Spiegelhalter discusses what constitutes a "tree" (which is incidentally defined as at least 12.7 cm in diameter breadth height), and how to answer the question by using sampling techniques. Other questions in the books are also well discussed: What is the cancer risk from bacon sandwiches? Can we trust the wisdom of crowds? Do busier hospitals have higher survival rates? Does going to university increase the risk of getting a brain tumour? Do statins reduce heart attacks and strokes? Is prayer effective? Why do old men have big ears? etc. These questions seem deceptively simple, but the answer -- or the process of reaching an answer -- is quite a scientific journey.
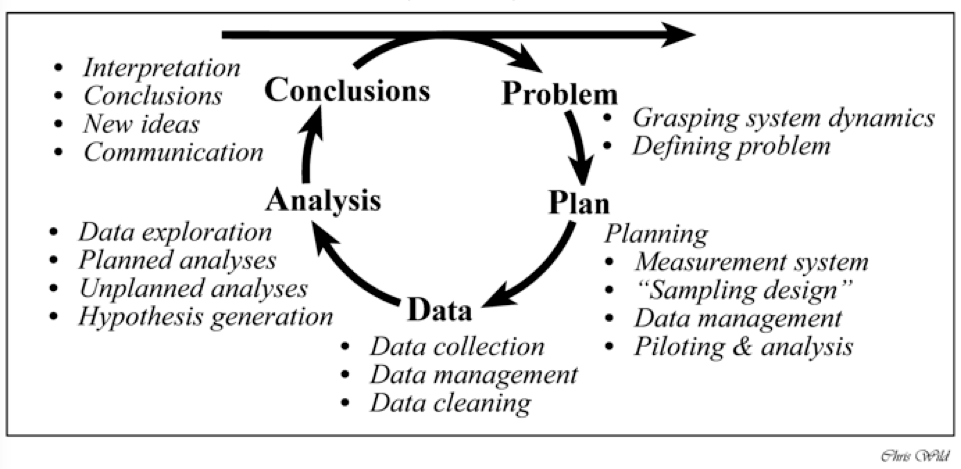
That scientific journey is called PPDAC which was advanced by New Zealand, a world leader in statistics education in school. In this approach, a research cycle is started off with a problem or research question (P). The second stage is to plan (P) a data collection procedure (i.e, an experiment), and to decide the variables to be measured in relation to the research question. The third stage is to actually perform the data collection (D), which means measurement, management, and cleaning. The fourth stage involves the analysis of data (A) which includes visualization, numerical description, and statistical modelling. The final stage is to make conclusion (C) or interpretation of the results of analysis. A new hypothesis or research question can be formed from the conclusion, and a new cycle of PPDAC starts again. I think that is a brilliant way to introduce statistics to students and the public at large.

Apart from those topics, Spiegelhalter briefly touches on 'data science', which is increasingly becoming a parlance in modern science these days. However, the definition of data science has not been consistent. Some think that data science, defined as 'the extraction of knowledge from data', is simply a new name for statistics in the computer age; others argue that it is a combination of computer science and statistics. My view is that data science is an integration of statistics and informatics. Informatics here encompasses information science, computation, and software engineering. While some people view data science as a threat to statistics, I would consider that data science is an opportunity for statistics. The opportunity to learn new concepts and ideas, and to engage in shaping the research agenda of cutting edge science such as genomics.
The book is aptly subtitled 'Learning from Data', suggesting an air of 'machine learning'. Actually, it is about statistical learning, not machine learning. Using the data collected from the Titanic disaster, Spiegelhalter introduced the idea and method of classification and metrics for evaluating the accuracy of a classification model. Issues of over-fitting and training data are also discussed. Readers are reminded that a statistical model -- whether it is about association, classification or prediction -- is a simple representation of the complexity of the natural world. A statistical model has two key components, a deterministic one and a random error, with the latter being expressed in terms of a probability distribution. As such, all statistical models are wrong, but as Tukey said, some models are still useful. And, to evaluate the usefulness of a statistical model is quite an art itself.
No discussion of statistics is complete without mentioning the P-value and the concepts of hypothesis testing and significance testing. Spiegelhalter does not discuss the history of the P-value idea in the book, but he does give a very standard definition. He also puts the P-value in the context of the current research ecosystem by asking the following question: what would happen if 1000 studies aimed to test 1000 hypotheses, each designed with type I error of 5% and type II error of 20% (ie 80% power), and if 10% of the null hypothesis were true? The answer is that we would expect that 36% of these discoveries are false discoveries. This is indeed a depressing picture of our present research literature. It is not surprising that the current crisis of reproducibility has been blamed on the misue of P-values.
We are living in a world awash with data which are daily propagated by the popular media, and this book can help us make sense of data (and even distinguish between good data from bad). A very important thing to remember is that data are products of social activities. And, to make sense of data, we must consider data in social context. Data without context mean nothing. For instance, statistical correlation does not necessarily mean causation -- a point raised by a commentator in Nature in 1900, when the coefficient was proposed by Karl Pearson. A beautiful example of data-in-context is the story about bacon and cancer risk. In September 2015, the World Health Organization (WHO) and International Agency for Research in Cancer (IARC) announced that processed meat (eg bacon, sausages) was classified as 'Group I carcinogen’, in the same category as cigarettes and asbestos. The reclassification was based on research data showing that each 50g of processed meat was associated with an 18% increase in the risk of bowel cancer. However, when the increased risk is considered within the background data (~6 out of 100 people are expected to get bowel cancer in their lifetime), the 18% number means one extra case, or 7 out of 100 lifetime bacon eaters, a very modest risk. The point of this simple exercise is that health risk should be contextualized and presented in absolute terms.
Sometimes, there is a total mismatch between what the research data show and what is conveyed to the public. The story about the ovarian cancer screening is a good case in point. On May 5, 2015, The Independent ran an article proclaiming that 'Ovarian blood tests breakthrough: huge success of new testing method could lead to National Screening Program.' However, the claim could not be further from the truth. The fact is that in the UK ovarian cancer clinical trial (involved more than 200,000 women), researchers found no statistically significant benefit of screening. Thus, there was an obvious breakdown of communication between researchers who produced the statistics and the popular media that conveyed the statistics to the public. Spiegelhalter suggests a list of 10 questions to ask when confronted with a claim based on statistical evidence. The 10 questions are grouped into three broad groups: the trustworthy of the statistics; the trustworthy of the source that produced the statistics; and the trustworthy of the interpretation.
The Art of Statistics is an excellent and timely account of statistics in the age of competing interests between emerging fields such as statistical learning, machine learning, deep learning, and the likes. Irrespective of the perceived competing interests, statistics still remains a science of extracting knowledge from data. I think it is probably not an overstatement to say that statistical science has the potential to shape research agendas of cutting edge sciences, and deepen our understanding of the natural world. The Art of Statistics further enlightens our daily life with surprising wisdoms. It is a book that should be in the bookshelf of every research laboratory, and would be a terrific addition to all family libraries. I highly recommend it.
====
PS: All figures and data in the book are available from the following webpage:
https://github.com/dspiegel29/ArtofStatistics


Comments